Why Contractors Struggle with Margin Erosion
Let’s be honest — margin erosion isn’t just a buzzword; it’s a silent killer for contractors. One bad BOQ (Bill of Quantities) item can snowball into an unprofitable project before you even know what’s happening. Why does this happen? Because many contractors don’t have the tools to catch problems early.
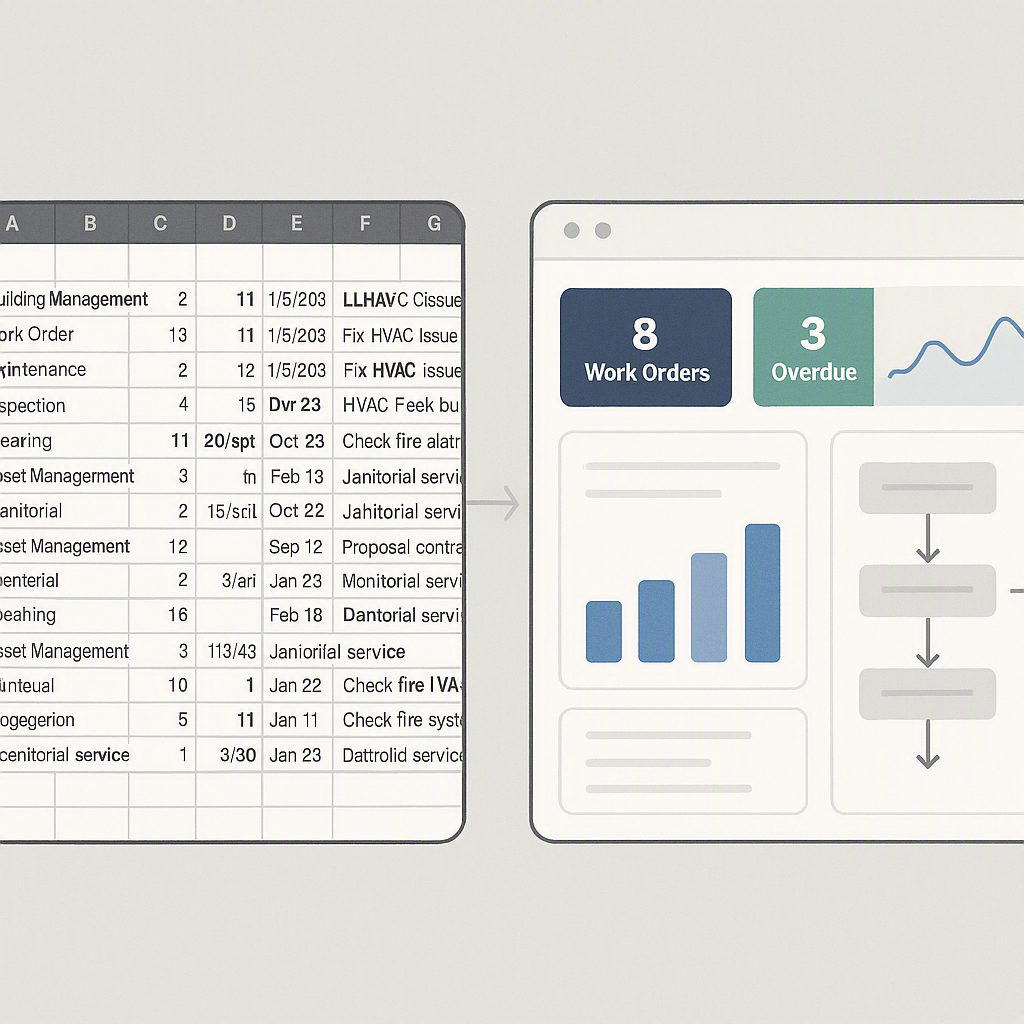
Here’s the deal: if you’re relying on spreadsheets or siloed systems to monitor costs, you’re already at risk. By the time you realize a BOQ item has a negative margin, it’s too late. You’ve already overspent.
What Causes Margin Erosion?
Margin erosion typically comes down to three culprits:
1. Estimation Errors
Estimation errors occur during preconstruction when calculations for labor, materials, equipment, or subcontractor costs are inaccurate. For example, failing to account for cost fluctuations or misjudging productivity rates can set your project on a losing trajectory.
How to Avoid This:
- Standardize Estimation Practices: Use templates or software that incorporate historical data to calculate costs reliably.
- Factor in Contingencies: Always include a buffer in your estimates to account for unforeseen circumstances.
- Audit Estimates Thoroughly: Before submitting bids, validate every BOQ item with input from procurement, site managers, and financial consultants.
2. Scope Changes
Unaccounted scope changes are another major driver of margin erosion. These changes often sneak in without proper documentation or updated pricing, leading to untracked costs.
How to Avoid This:
- Implement Change Order Protocols: Every scope variation should go through a formal approval process, including updated cost calculations.
- Track Changes Real-Time: Use project management software to log scope changes as they happen.
- Train Project Teams: Ensure your team understands the importance of pricing adjustments for scope changes.
3. Procurement Cost Overruns
Vendor prices exceeding original estimates can surprise contractors if procurement workflows aren’t tightly controlled. If RFQs (Request for Quotes) aren’t standardized or bulk purchase opportunities are missed, procurement costs can spiral.
How to Avoid This:
- Centralize Procurement: Use procurement software that links vendor RFQs to BOQ margins directly.
- Negotiate Bulk Discounts: Build relationships with vendors to secure better rates for high-volume orders.
- Monitor Market Trends: Keep an eye on commodity prices for materials like steel, concrete, and copper.
The Role of a Profitability Calculator
A project profitability calculator flips the script. Instead of reacting to losses, you proactively monitor every BOQ item’s margin. Tools like JobNext’s BOQ Margin Report make this possible.
How It Works
The report compares contracted values against actual costs — labor, material, equipment, subcontractor, and overhead — on a per-item basis. If any BOQ item shows a negative margin, it’s flagged immediately. This gives you the chance to investigate and fix the issue before it spirals.
Actionable Steps to Use a Profitability Calculator:
- Set Up Weekly Reviews: Schedule recurring sessions to analyze BOQ margin reports.
- Identify Negative Margins: Pay attention to flagged items and prioritize investigation.
- Investigate Root Causes: Dig into labor inefficiencies, procurement issues, or scope changes.
- Take Corrective Action: Renegotiate vendor terms, tighten process controls, or adjust workforce allocation.
Why Weekly Reviews Matter
JobNext documentation strongly recommends reviewing BOQ margin reports weekly. Why? Because negative margins compound quickly. If you wait until month-end, you might find that one bad BOQ item has tanked your entire project’s profitability.
Benefits of Weekly Reviews
- Early Detection: Spot issues before they become unmanageable.
- Smaller Corrections: Address small variances before they grow.
- Improved Accountability: Teams stay aligned with profitability goals.
How to Implement Weekly Reviews:
- Assign a team member to prepare margin reports every Friday.
- Use a checklist to ensure all BOQ items are analyzed.
- Share findings during Monday site meetings to plan corrective actions.
Tools That Make It Easier
Here’s where structured tools like JobNext shine. Their BOQ Margin Report isn’t just about showing numbers. It breaks down costs into:
- Quoted Rate: The price you bid.
- Actual Cost Rate: What you’ve spent so far.
- Variance Analysis: Highlights discrepancies between the two.
Additional Features to Look For
- Integration with Procurement: Real-time syncing with vendor RFQs.
- Multi-Project Tracking: Monitor margins across multiple projects simultaneously.
- Custom Alerts: Notify teams when margin thresholds are breached.
Comparison Table: Spreadsheets vs. Profitability Calculators
| Feature | Spreadsheets | Profitability Calculators |
|---|---|---|
| Real-time Margin Tracking | No | Yes |
| Error Detection | Manual | Automated |
| Scope Change Integration | No | Yes |
| Multi-Project Management | Difficult | Easy |
| Procurement Integration | No | Yes |
Common Mistakes Contractors Make
Even with the right tools, margin erosion persists if you’re not careful. Here are common pitfalls:
1. Ignoring Small Variances
A 5% cost overrun might seem minor, but across 100 BOQ items, it adds up fast.
2. Delaying Corrective Action
Negative margins won’t fix themselves. The longer you wait, the bigger the losses.
3. Overestimating Efficiency
Tools like JobNext let you apply cost-saving assumptions (e.g., 95% efficiency). But unrealistic assumptions lead to underquoting.
How to Avoid These Mistakes:
- Set Clear Thresholds: Establish acceptable variance limits and act immediately when exceeded.
- Train Teams: Ensure staff understands the importance of acting on margin data.
- Use Historical Data: Base assumptions on past performance, not guesses.
FAQ
Q: Can a profitability calculator prevent all margin erosion?
A: No tool is perfect. But it drastically reduces the risk by flagging problems early. The key is acting on the insights it provides.
Q: How does this integrate with procurement workflows?
A: Tools like JobNext auto-link BOQ margins to procurement data. If a vendor’s RFQ exceeds your estimate, it’s reflected in the margin report immediately.
Q: Is this useful for small contractors?
A: Absolutely. Whether you’re running a ₹5 crore or ₹100 crore project, margin erosion scales with your BOQ complexity. A calculator helps at any level.
Q: What’s the ideal frequency for margin reviews?
A: Weekly reviews are ideal for most projects. They strike a balance between proactive monitoring and actionable corrections.
Q: Can I use profitability calculators with existing tools?
A: Yes. Most modern calculators integrate seamlessly with popular project management and procurement tools.
Final Thoughts
In my view, no contractor should manage projects without a profitability calculator. The risk is too high, and the tools are too accessible. If you’re still relying on spreadsheets or disconnected systems, it’s time for a change.
JobNext’s BOQ Margin Report is one such tool that simplifies margin tracking across multiple projects. It’s not magic — it’s math. But it’s math that can save your business.
Learn more at JobNext.ai