The Silent Killer: Margin Erosion in Contracting
Every contractor has been there. You win a project, the numbers look good on paper, and you’re confident you’ll hit your profit targets. Then, mid-way through, the costs start creeping up. Material rates fluctuate, subcontractor bills pile up, or labor overruns eat into the budget. Before you know it, your margins are gone—or worse, the project is running at a loss.
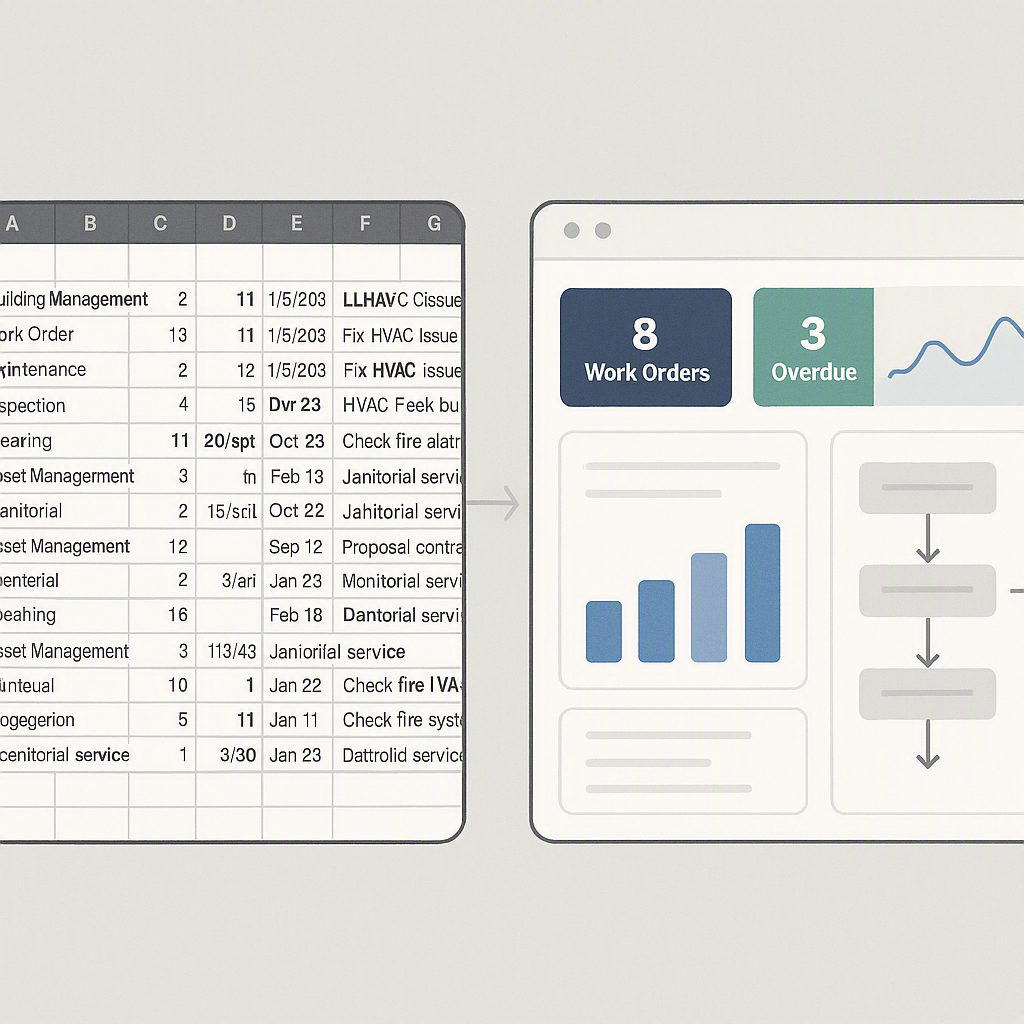
Why does this happen? For most contractors, it’s the lack of real-time visibility. You don’t know where the costs are spiraling until it’s too late. Fixing this requires more than spreadsheets or gut instinct; it demands tools that show you where your money is going as it happens.
Enter the BOQ Margin Monitoring Dashboard
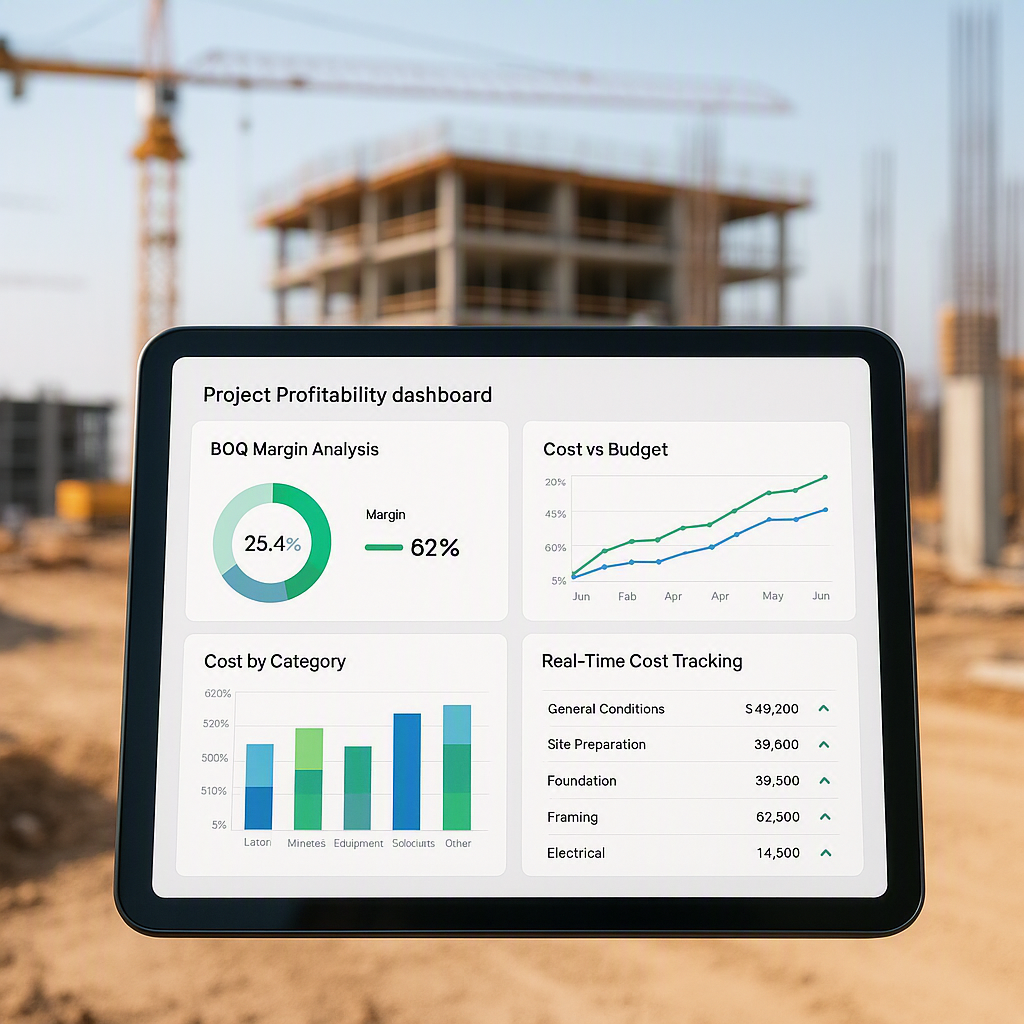
A project profitability dashboard focuses on one thing: giving you a clear, real-time picture of your financial health. At its core is the BOQ Margin Report, a tool specifically designed to monitor profit margins by comparing contracted values against actual costs across five resource factors—labor, material, plant, subcontractor, and overhead.
How It Works
-
Contracted Value vs. Actual Cost: For every Bill of Quantity (BOQ) item, the dashboard compares what you budgeted versus what you’re spending. If actual costs exceed the contracted margin, you’ll see it immediately.
- Example: If you budgeted ₹50 lakh for labor and your actual costs reach ₹55 lakh mid-project, the dashboard flags this variance instantly.
-
Real-Time Alerts on Negative Margins: The system flags BOQ items where costs are running higher than planned. For example, if subcontractor payments for a specific scope exceed the budget, the dashboard highlights it as a negative-margin item.
- Actionable Tip: Set threshold alerts so that even minor overruns trigger warnings. For instance, if a cost variance exceeds 5%, the dashboard can notify you.
-
Drill-Down Analysis: Want to know why a particular BOQ item is eroding margins? The dashboard lets you drill down to see whether it’s due to labor overruns, material price hikes, or inefficient resource allocation.
- Pro Tip: Use drill-downs to identify patterns. For instance, if labor overruns consistently appear in certain scopes, investigate whether the issue lies in productivity, scheduling, or misaligned rates.
Practical Methods to Stop Margin Erosion Early
1. Monitor Material Costs in Real-Time
Material costs are one of the biggest contributors to margin erosion, especially when prices fluctuate unexpectedly. A profitability dashboard allows you to track material consumption and procurement costs as they happen.
- Method: Use the BOQ Margin Report to compare contracted material costs with actuals. If a material cost trend appears unfavorable (e.g., steel prices rising 15% mid-project), act immediately.
- Actionable Steps:
- Negotiate better rates with suppliers using volume-based contracts.
- Explore alternative suppliers for competitive pricing.
- Reassess procurement schedules to minimize exposure to market volatility.
2. Track Subcontractor Payments Closely
Subcontractor costs often spiral due to unclear scope, change orders, and labor inefficiencies. The dashboard can track subcontractor performance and highlight cost overruns.
- Method: Regularly reconcile subcontractor invoices with BOQ margins. If a subcontractor consistently overruns budgets, revisit their contract terms.
- Actionable Steps:
- Implement milestone-based payments to align subcontractor costs with progress.
- Use dashboards to compare subcontractor productivity across projects.
3. Audit Labor Productivity Weekly
Labor overruns often stem from inefficiencies, delays, or mismanagement. A weekly review of labor-specific BOQ items can help you identify problem areas fast.
- Method: Use the dashboard’s drill-down feature to analyze labor hours versus output. If labor productivity declines, investigate root causes such as poor scheduling or unskilled workers.
- Actionable Steps:
- Train crews on productivity standards.
- Utilize daily work logs to correlate labor hours with completed tasks.
Why Weekly Reviews Are a Game-Changer
In my experience, the contractors who succeed with margin control don’t just look at dashboards occasionally. They make it a habit. A weekly review of the BOQ Margin Report ensures that any negative-margin items are caught and corrected before they snowball into bigger problems.
Actionable Weekly Review Checklist:
- Review Negative-Margin BOQ Items: Identify any items where actual costs exceed the contracted value.
- Investigate Variances: Drill down into flagged items to determine whether the issue lies in labor, material, subcontractor, plant, or overhead.
- Take Immediate Action: Address discrepancies by renegotiating contracts, reallocating resources, or revising schedules.
JobNext’s own documentation emphasizes this point: “Review BOQ Margin at least weekly. Negative-margin BOQ items require immediate investigation—they may indicate that actual costs have exceeded the original estimate, which can erode overall project profitability.”
Common Mistakes Contractors Make
Margin erosion often feels unavoidable, but it’s frequently caused by preventable mistakes. Here are the most common pitfalls:
1. Ignoring Small Variances
A ₹2 lakh overrun might seem minor on a ₹20 crore project, but these “small” variances add up fast. Always address them early.
- Actionable Tip: Treat every cost variance as a red flag, no matter how small. The dashboard can help you aggregate small variances across BOQ items to understand their cumulative impact.
2. Overreliance on Gut Instinct
Many contractors rely on experience to judge project health. But without real-time data, even the most seasoned managers can miss hidden cost drains.
- Actionable Tip: Pair your intuition with data-driven insights from dashboards. Intuition may help you identify potential risks, but dashboards confirm the financial impact.
3. Waiting for Monthly Reports
By the time monthly financials arrive, it’s often too late to fix margin erosion. Dashboards give you the real-time edge you need.
- Actionable Tip: Replace monthly cost reviews with weekly dashboard checks.
Comparison Table: Spreadsheet vs. Profitability Dashboard
| Feature | Spreadsheet | Profitability Dashboard |
|---|---|---|
| Real-Time Visibility | No | Yes |
| Automated Alerts | No | Yes |
| Drill-Down Analysis | Limited | Comprehensive |
| Data Integration | Manual input required | Seamless integration |
| Ease of Use | Time-consuming | Intuitive and fast |
FAQ
Q1: How often should I monitor BOQ margins?
Weekly is ideal. Regular reviews let you catch variances early and take corrective action.
Q2: Can this dashboard integrate with accounting tools like Tally?
Yes, tools like JobNext offer Tally integration for seamless financial reporting and statutory compliance.
Q3: What if my team isn’t tech-savvy?
Most dashboards are built with user-friendly interfaces. JobNext, for example, offers intuitive visualizations and training support for teams.
Q4: Is this only for large contractors?
Not at all. Small and mid-sized contractors benefit the most from margin monitoring because they have less room for error.
Q5: Can dashboards prevent cost overruns entirely?
No tool can eliminate overruns completely, but dashboards significantly reduce their frequency and severity by providing real-time insights and alerts.
Final Thoughts
Real-time project profitability tracking isn’t optional anymore—it’s critical. Contractors who embrace tools like BOQ Margin Reports and dashboards gain a competitive edge, not just in cost control but in decision-making speed. If margin erosion has been a recurring challenge, it’s time to rethink your approach.
Ready to take control of your project profitability? Try JobNext today →
Learn more at JobNext.ai