Why Most Profitability Templates Fail
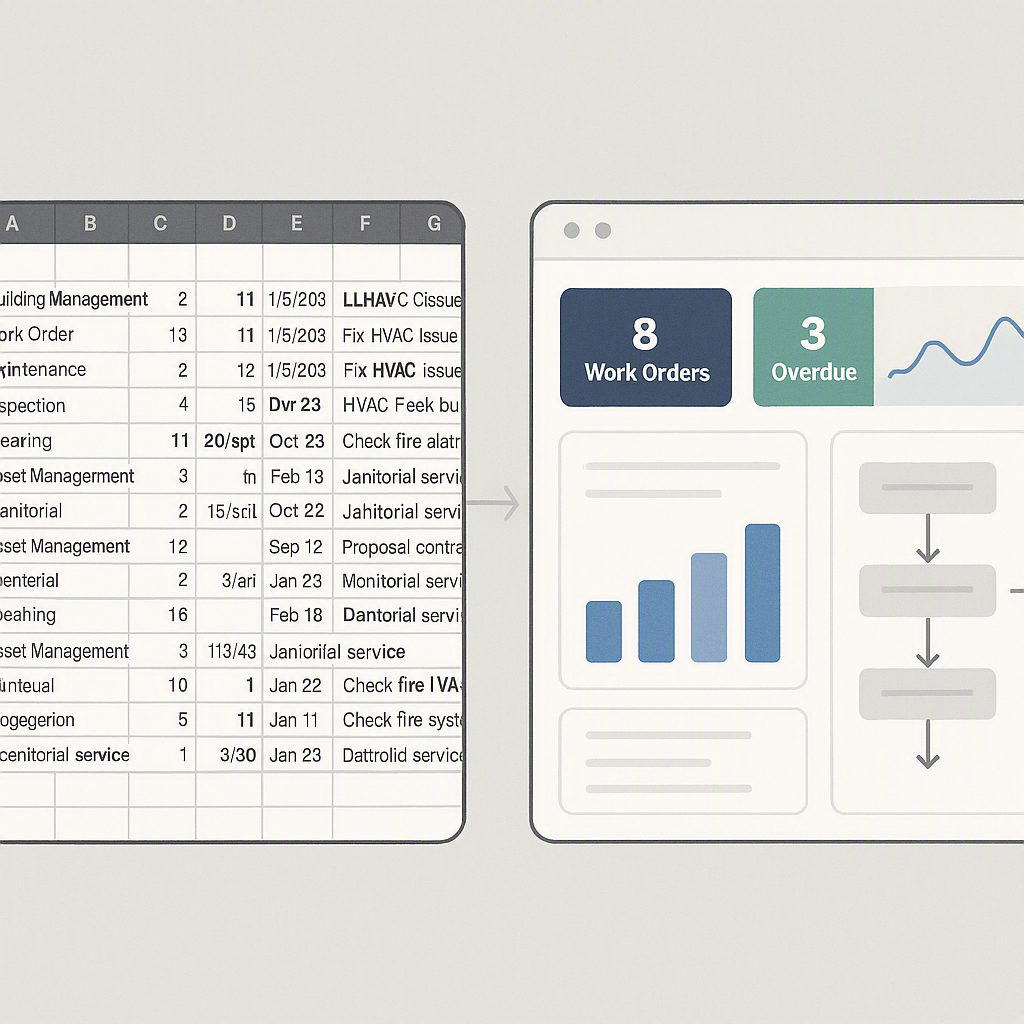
Let’s face it — most project profitability analysis templates are a mess. The formulas break, the inputs are inconsistent, and they’re impossible to scale across multiple projects. Contractors and project managers spend more time fixing these templates than using them. What’s the point?
The problem isn’t Excel itself. It’s how we approach it. Many templates are built without a clear structure or the right data inputs. They’re reactive, not proactive. And the result? Decisions get delayed, margins shrink, and projects bleed money before anyone notices.
This article will walk you through actionable steps to create a profitability analysis template that works. We’ll focus on BOQ-level granularity, dynamic cost tracking, and actionable insights, while also addressing common questions and pitfalls.
The Key to a Template That Works
A project profitability analysis template needs three things:
-
BOQ-level granularity: You need to track profitability at the Bill of Quantities (BOQ) level. Why? Because not all BOQ items contribute equally to your margin. Some are cash cows; others are landmines. Without this granularity, you’re flying blind.
-
Dynamic cost tracking: Fixed cost assumptions don’t cut it. Your template must account for real-time updates to material, labor, and subcontractor costs. Static inputs are outdated the moment the project starts.
-
Actionable insights: The best template doesn’t just report numbers. It flags issues — like negative-margin BOQ items — so you can act before they spiral out of control.
We’ll show you how to build this step by step. And if you stick around, we’ll also explain how tools like JobNext automate profitability tracking so you can focus on managing projects, not spreadsheets.
Step 1: Define Your Structure
Your template needs to follow the same structure as your project. For most contractors, this means setting it up based on the BOQ hierarchy. Think about it like this:
Hierarchy Breakdown
- Job Level: Overall profitability for the project
- BOQ Level: Profitability for each BOQ item
- Resource Level: Breakdown of costs into labor, materials, plant, subcontractor, and overhead
Here’s an example structure to replicate:
| BOQ Item | Contract Value | Actual Cost | Margin | Margin % |
|---|---|---|---|---|
| Earthworks | ₹10,00,000 | ₹8,50,000 | ₹1,50,000 | 15% |
| Foundation | ₹15,00,000 | ₹14,00,000 | ₹1,00,000 | 6.7% |
| Roofing | ₹8,00,000 | ₹8,25,000 | -₹25,000 | -3.1% |
Actionable Steps
- Start with BOQ items: List all BOQ items in your project. Include their contract values and codes.
- Add cost categories: Break down each BOQ into labor, materials, plant, subcontractor, and overhead costs.
- Summarize margins: Calculate margins at both BOQ and job levels.
- Create a summary table: Build a summary table at the top that aggregates profitability data by BOQ item and resource type. This allows stakeholders to see the big picture without scrolling through endless rows.
Pro Tip: Use consistent naming conventions for BOQ codes and resource categories. This will make formulas and automation much easier.
Step 2: Automate Cost Inputs
Manual data entry is a recipe for errors. Automate as much as possible to ensure accuracy and save time.
Automating Labor Costs
- Link your template to attendance or payroll data. Many construction companies use software to track labor hours and wages. Integrate this data directly into your template.
- Example formula: Create a lookup table for wage rates and multiply by hours worked.
=VLOOKUP(EmployeeID, WageTable!$A:$C, 2, FALSE) * HoursWorked
Automating Material Costs
- Use live procurement data. If your company has a structured workflow (e.g., Material Request → RFQ → Purchase Order), pull the latest vendor rates. Tools like JobNext automate this process.
- Example formula: Use SUMIFS to sum costs based on BOQ codes.
=SUMIFS(MaterialCosts!$B:$B, MaterialCosts!$A:$A, BOQ!A2)
Automating Subcontractor Costs
- Track progress-based payments. Subcontractor costs often correlate with the percentage of work completed. Use a progress tracking system to calculate these costs dynamically.
- Example formula: Multiply contract value by progress percentage.
=SubcontractorValue * ProgressPercent
Pro Tip: Use external integrations or tools like JobNext to pull real-time data into your template.
Step 3: Build Margin Alerts
It’s not enough to track costs and revenue. Your template should alert you to problem areas.
Setting Up Alerts
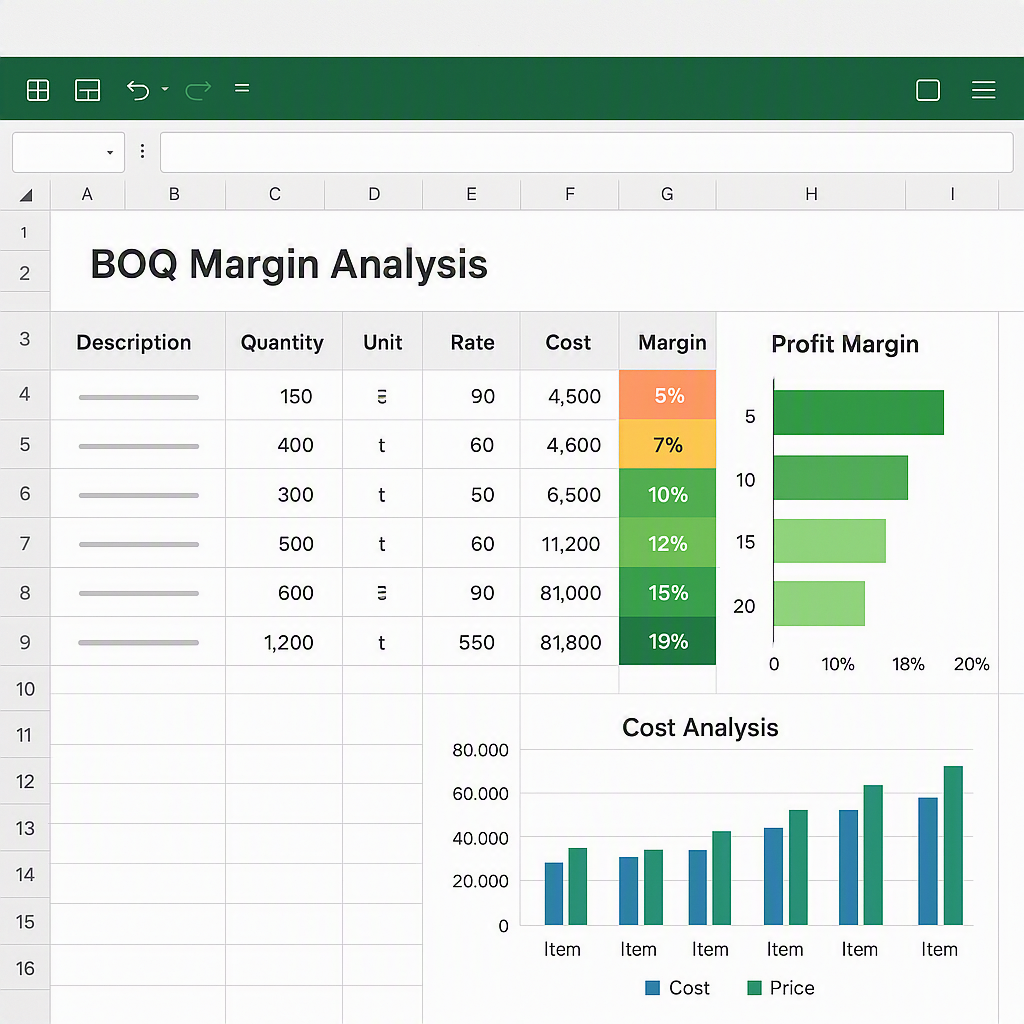
Use conditional formatting in Excel to highlight negative-margin items or those with margins below a threshold (e.g., 10%).
- Select the "Margin %" column.
- Apply formatting rules:
- Red for negative margins
- Yellow for margins below 10%
- Green for margins above 10%
Example:
| BOQ Item | Margin % |
|---|---|
| Earthworks | 15% (Green) |
| Foundation | 6.7% (Yellow) |
| Roofing | -3.1% (Red) |
Step 4: Add a Dashboard
Executives don’t want to dig through rows and columns. Build a simple dashboard that visualizes your data.
Dashboard Components
- Top 5 BOQ Items by Margin: Use a bar chart to show which items contribute most to profitability.
- Negative Margin Tracker: Highlight BOQ items with negative margins in a table or pie chart.
- Overall Profitability Trend: Use a line chart to show how project profitability changes over time.
Pro Tip: Keep dashboards simple and focus on actionable insights. Too much data can overwhelm stakeholders.
Step 5: Review Weekly
Profitability analysis isn’t a one-and-done exercise. Costs change, scope creeps, and unexpected delays hit margins. Review your template weekly — or daily for critical projects.
Weekly Checklist
- Check the BOQ Margin Report for negative-margin items.
- Review the Resource Reconciliation Report to compare budgeted vs. actual costs.
- Update actual costs and progress data to keep insights current.
Pro Tip: Schedule a recurring meeting with your team to review the template and discuss action items.
Common Mistakes to Avoid
- Ignoring BOQ Granularity: Without BOQ-level tracking, you won’t spot problem areas early.
- Relying on Static Costs: Update your template with real-time data, especially for materials and subcontractors.
- Overcomplicating the Template: Simplicity wins. Avoid clutter and focus on the metrics that matter.
FAQ
Q1: Can I use this template for all construction projects? Yes, but you’ll need to customize it for each project’s BOQ structure and resource breakdown.
Q2: How do I handle scope changes? Add a column for revised contract values and track changes separately to avoid mixing them with original estimates.
Q3: What’s the easiest way to automate cost tracking? Use tools like JobNext, which integrates procurement, payroll, and subcontractor management into a single platform.
Q4: Can I implement conditional formatting in Google Sheets? Yes, Google Sheets provides similar conditional formatting options as Excel. Navigate to Format > Conditional Formatting and set your rules.
Q5: How often should I update cost inputs? Ideally, update cost inputs weekly, or more frequently for fast-moving projects with fluctuating material or labor costs.
Conclusion
A well-designed profitability analysis template isn’t just a spreadsheet. It’s a decision-making tool. By focusing on BOQ margins, automating cost inputs, and building actionable dashboards, you can turn a reactive process into a proactive one.
But if you’re tired of managing this manually, consider tools like JobNext. Its BOQ margin reports and real-time analytics take the heavy lifting off your plate, so you can focus on running profitable projects.
Learn more at JobNext.ai