Understanding Margin Challenges in Construction Projects
Margins in construction are often razor-thin, and even small missteps can lead to significant margin erosion. This can occur due to underestimated costs, scope changes, or procurement overruns. Without clear visibility into a project’s real-time profitability, these issues can escalate unnoticed.
Let’s explore how to create a project profitability report that not only tracks numbers but also helps prevent margin loss.
What Should a Project Profitability Report Include?
A good profitability report isn’t just a summary of costs versus revenue. It’s a diagnostic tool that answers three key questions:
- Where are we losing money?
- Why are we losing money?
- What can we do to fix it before it’s too late?
Here’s what your report needs to cover:
1. BOQ Margin Analysis
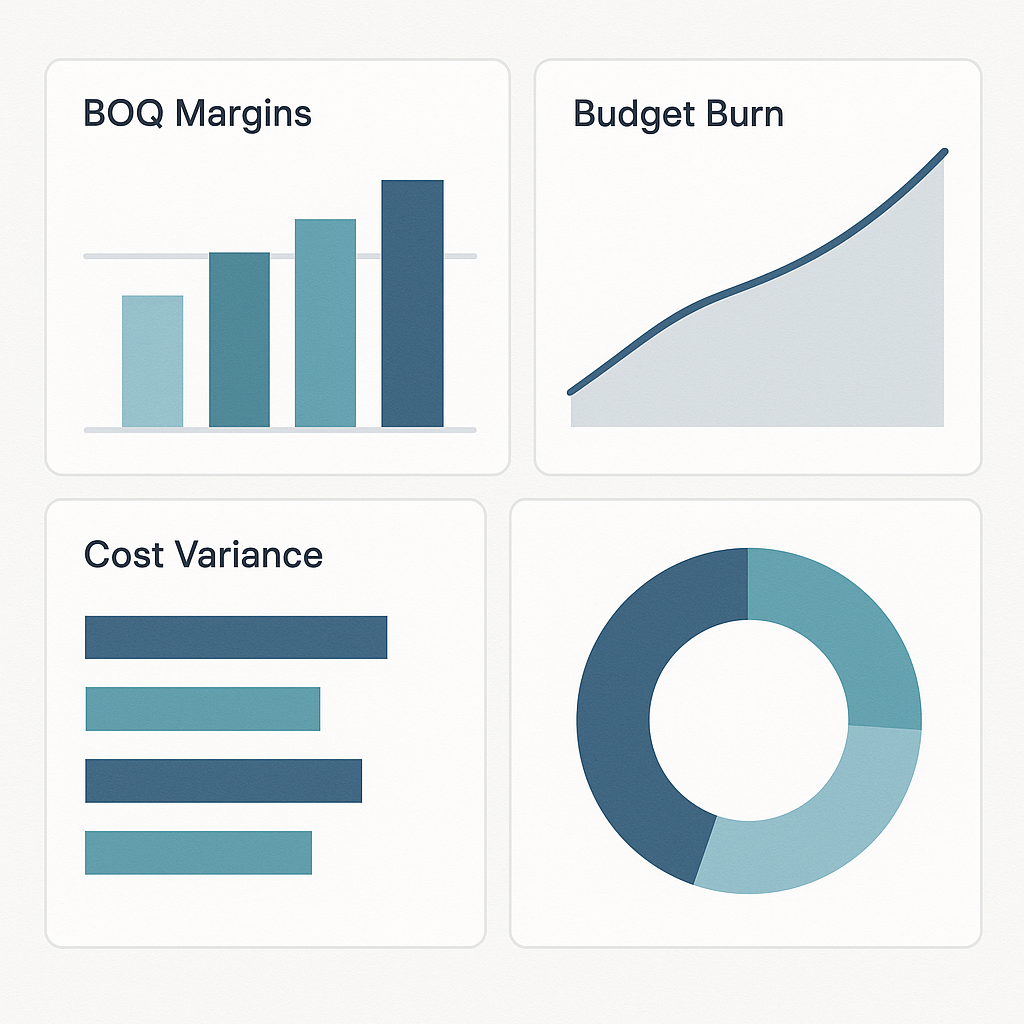
Break down profitability by BOQ (Bill of Quantities) items. A BOQ margin analysis compares contracted values against actual costs for labor, materials, equipment, subcontractors, and overhead. If any BOQ line item shows a negative margin, it’s a red flag.
2. Budget Burn Rates
Monitor how fast you’re using up your budget. Split it into categories: labor, materials, equipment, subcontractors, and overhead. If you notice that one category is being depleted faster than expected, investigate the cause.
3. Variance Analysis
Compare actual costs to your estimated budget to identify where you’re overspending. Variance analysis helps pinpoint anomalies early, allowing you to address issues before they escalate.
4. Projected P&L
A projected P&L (Profit and Loss) statement provides a mid-project snapshot of expected profitability. Regular updates to this report can help you understand the financial trajectory of your project.
Step-by-Step: Building Your Profitability Report
Let’s break down the process:
Step 1: Standardize Your BOQ
Start with a clean, detailed BOQ. Every item needs to have clear quantities, rates, and scope definitions. This becomes your baseline for tracking costs and margins.
Step 2: Track Costs in Real-Time
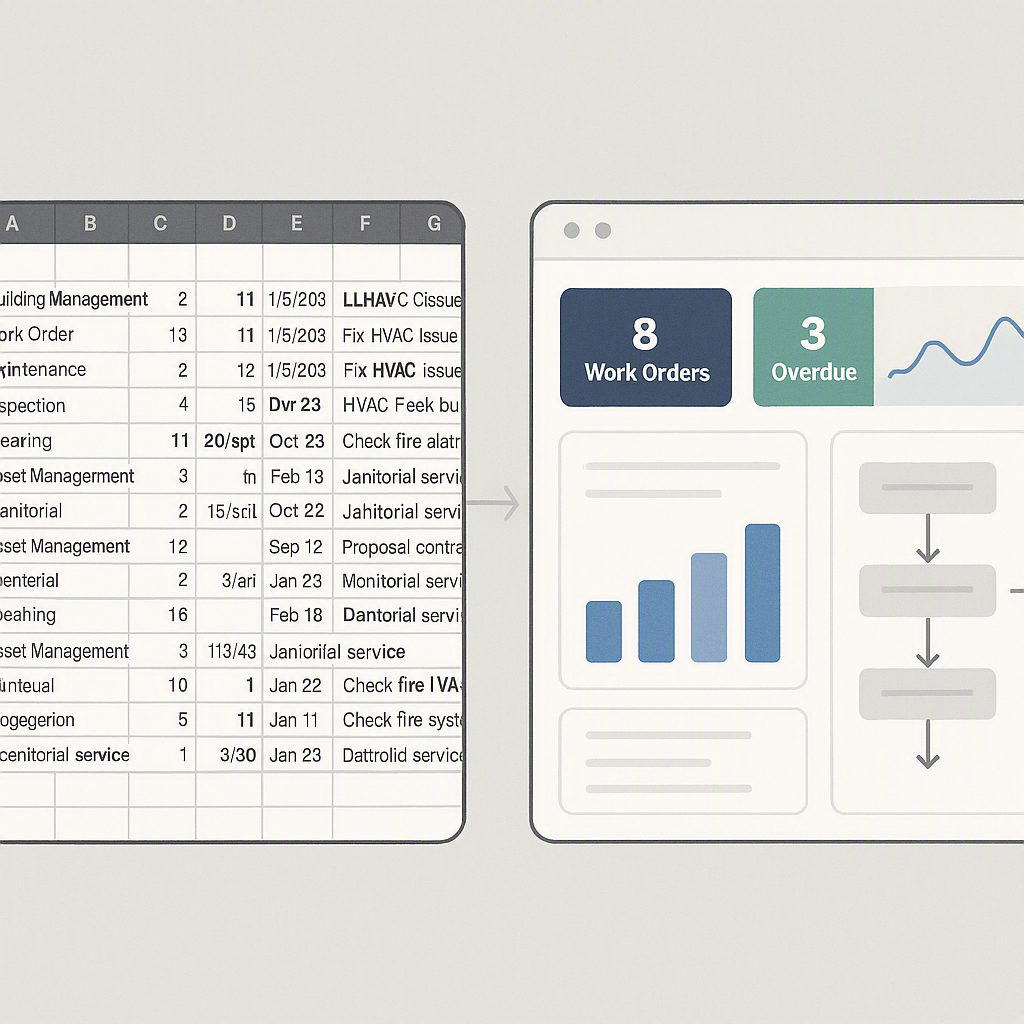
Manual cost tracking can be error-prone and time-consuming. Consider using an ERP system to automate cost tracking and tie vendor costs directly to BOQ items.
Step 3: Monitor Your BOQ Margin Weekly
Review your BOQ margin report regularly. Look for items with negative margins and investigate the causes, such as procurement issues, subcontractor cost overruns, or unapproved scope changes.
Step 4: Cross-Check Your Budget Burn
Use budget burn reports to compare actual versus budgeted costs. If material consumption is higher than planned, check procurement logs for potential over-ordering or wastage.
Step 5: Review Variance Analysis
Variance reports highlight where actual costs exceed estimates. If labor costs are over budget, for example, check site attendance records to determine if overstaffing is the issue.
Step 6: Update Your Projected P&L
Update your projected P&L with the latest data whenever there’s a significant cost or scope change. At a minimum, this should be done monthly.
Common Mistakes to Avoid
Even the best reports are ineffective if not acted upon. Here are common pitfalls to avoid:
- Ignoring Negative Margins: Investigate BOQ items showing losses immediately.
- Infrequent Reviews: Conduct weekly reviews to catch issues early.
- Disconnected Systems: Ensure your procurement, billing, and HR systems are integrated for complete data.
- Lack of Accountability: Assign responsibility for each cost category to ensure timely action.
FAQs
Q1: How often should I review my project profitability report?
Weekly reviews are recommended to identify and address issues promptly.
Q2: Can this process work without ERP software?
While possible, manual tracking can be cumbersome and prone to errors. ERP systems streamline data collection and reporting.
Q3: What’s the biggest cause of margin loss?
Misaligned costs and scope changes are common culprits, highlighting the importance of real-time tracking and BOQ margin analysis.
Q4: What’s the difference between budget burn and variance analysis?
Budget burn tracks how quickly your budget is being used, while variance analysis compares actual costs to budgeted amounts to identify overspending.
Q5: When should I update my projected P&L?
Update your projected P&L whenever there’s a significant cost or scope change, or at least monthly.
Conclusion
Creating a project profitability report is essential for identifying problems early and taking corrective action to prevent margin erosion. By implementing real-time tracking and regular reviews, you can ensure your projects stay on track financially.
Learn more at JobNext.ai