How to Use BOQ Margin Reports to Prevent Profit Erosion
Margin erosion is a silent killer in construction projects. Costs creep up, estimates miss the mark, and before you know it, your profits are gone. But there’s a way to catch these issues early: BOQ margin reports. These reports track profitability at the most granular level—by individual Bill of Quantities (BOQ) items.
This article dives deep into how to use BOQ margin reports effectively, provides actionable steps for better project control, and addresses common questions practitioners face. By the end, you’ll have a clear framework for turning BOQ margin reports into a profit-protection tool.
Why BOQ Margins Matter
BOQ margin reports compare your contracted values to actual costs—split across key resource categories: material, labor, subcontractors, overheads, and machines. These reports provide transparency into whether your project is on track financially.
How Negative Margins Impact Your Project
If any BOQ item shows negative margins, it’s an early warning sign. These can arise from:
- Estimation errors: Your initial cost assumptions were inaccurate, leading to underpriced bids.
- Scope changes: Unapproved changes or scope creep inflate costs without corresponding revenue.
- Procurement overruns: Material costs exceed what was originally budgeted due to price fluctuations or inefficiencies.
Over time, ignoring negative margins can lead to compounding losses that erode profitability across the entire project. Fixing them early is the difference between maintaining a healthy bottom line and bleeding cash.
Example Scenarios
Let’s consider how BOQ margins can highlight issues:
- Material Costs: If a BOQ item for steel shows negative margins, it could indicate higher-than-expected procurement costs. Reviewing vendor agreements and negotiating better rates might help.
- Labor Costs: A BOQ item for excavation labor could show overruns due to overtime hours or low productivity. Identifying the root cause (e.g., inefficiencies or errors in scheduling) ensures future control.
How to Read a BOQ Margin Report
A BOQ margin report is only as useful as your ability to interpret it. A good report breaks profitability into clear sections:
Key Report Components
- Contracted Value: The amount agreed upon with the client for each BOQ item.
- Budgeted Cost: Your initial estimate of how much it’ll cost to deliver the item.
- Actual Cost: Real-world costs derived from procurement, payroll, and subcontractor invoices.
- Margin: The difference between contracted value and actual cost, expressed in both absolute numbers and percentages.
Example Table
| BOQ Item | Contracted Value | Budgeted Cost | Actual Cost | Margin |
|---|---|---|---|---|
| Excavation (100m³) | ₹5,00,000 | ₹4,00,000 | ₹4,50,000 | -₹50,000 |
| Concrete (50m³) | ₹2,00,000 | ₹1,50,000 | ₹1,40,000 | ₹60,000 |
| Steel (2 Tons) | ₹3,00,000 | ₹2,50,000 | ₹2,80,000 | -₹30,000 |
Illustrative example — not actual data
Questions to Ask When Analyzing Margins
- Are negative-margin items isolated or widespread? Focus on problematic BOQ items while keeping an eye on overall project trends.
- Do negative margins reflect estimation, procurement, or execution errors? Pinpoint the root cause to drive corrective action.
- Can costs be reduced or recovered? For example, renegotiate vendor contracts or optimize resource allocation to protect margins.
Best Practices for Using BOQ Margin Reports
To maximize the value of BOQ margin reports, follow these actionable strategies:
1. Run Weekly Reviews
Margins change quickly in construction. A delay in catching cost overruns can turn manageable issues into major losses. Weekly reviews ensure:
- Early identification of negative-margin items.
- Prompt investigation into cost overruns.
- Adjusted procurement or labor strategies to prevent future erosion.
How to Implement Weekly Reviews:
- Schedule a recurring meeting with your project management team.
- Use automated tools like JobNext to generate updated margin reports before each review.
- Focus discussions on actionable insights (e.g., specific BOQ items with negative margins).
2. Leverage Drilldowns
A summary report provides a high-level overview, but drilldowns are key to fixing problems. Break down margins across resource categories:
- Material Costs: Investigate purchase orders, vendor pricing, and delivery schedules.
- Labor Costs: Compare actual attendance records to payroll data. Identify inefficiencies.
- Subcontractor Costs: Scrutinize invoices and completed work against your budget.
Example Drilldown Process:
If excavation shows negative margins, drill into labor costs:
- Check attendance logs for discrepancies.
- Compare planned productivity rates to actual performance.
- Review overtime costs and approval processes.
3. Combine Reports for Holistic Insights
BOQ margin reports are powerful on their own, but integrating them with other reports provides a fuller picture:
| Report Type | Purpose | Example Use Case |
|---|---|---|
| BOQ Progress | Tracks actual completion rates of items | Identify delays in excavation tasks |
| Resource Reconciliation | Compares resource usage to budgeted amounts | Spot material wastage |
| Budget Burn | Tracks overall budget consumption rates | Prevent overspending early |
Tools like JobNext allow seamless integration of these reports, providing actionable dashboards for decision-making.
Common Mistakes to Avoid
1. Ignoring Negative Margins
Focusing only on overall profitability while neglecting individual BOQ items is a common error. Negative margins can snowball into broader project losses. Addressing issues at the item level prevents larger financial problems.
2. Skipping Drilldowns
Summary reports are useful, but they often hide critical details. Without drilldowns, you risk missing the root causes of margin erosion—whether it’s inaccurate estimates, procurement inefficiencies, or execution errors.
3. Reviewing Too Late
A monthly review cadence is often insufficient. By the time issues surface, significant budget erosion may already have occurred. Weekly reviews are essential for early intervention.
4. Lack of Accountability
Without clear ownership over BOQ margins, problems can persist. Assign responsibility for tracking and resolving negative-margin items to specific team members.
FAQ
Q1: What’s the difference between markup and margin?
Markup is the percentage you add to costs to set your price. Margin is the percentage of revenue left after covering costs. For example, if a project costs ₹10 lakh and you price it at ₹12 lakh, your markup is 20%, but your margin is ~16.7%.
Q2: How do I calculate margin percentage?
Use this formula:
Margin % = (Revenue - Costs) ÷ Revenue × 100
For example, if revenue is ₹12 lakh and costs are ₹10 lakh:
Margin % = (₹12,00,000 - ₹10,00,000) ÷ ₹12,00,000 × 100 = 16.7%
Q3: Can BOQ margin analysis improve bidding accuracy?
Yes. Reviewing margins from past projects highlights common estimation errors, which can help refine your bids for future projects. For example, if material costs consistently exceed estimates, you can adjust future bids to account for realistic pricing.
Q4: What tools generate BOQ margin reports?
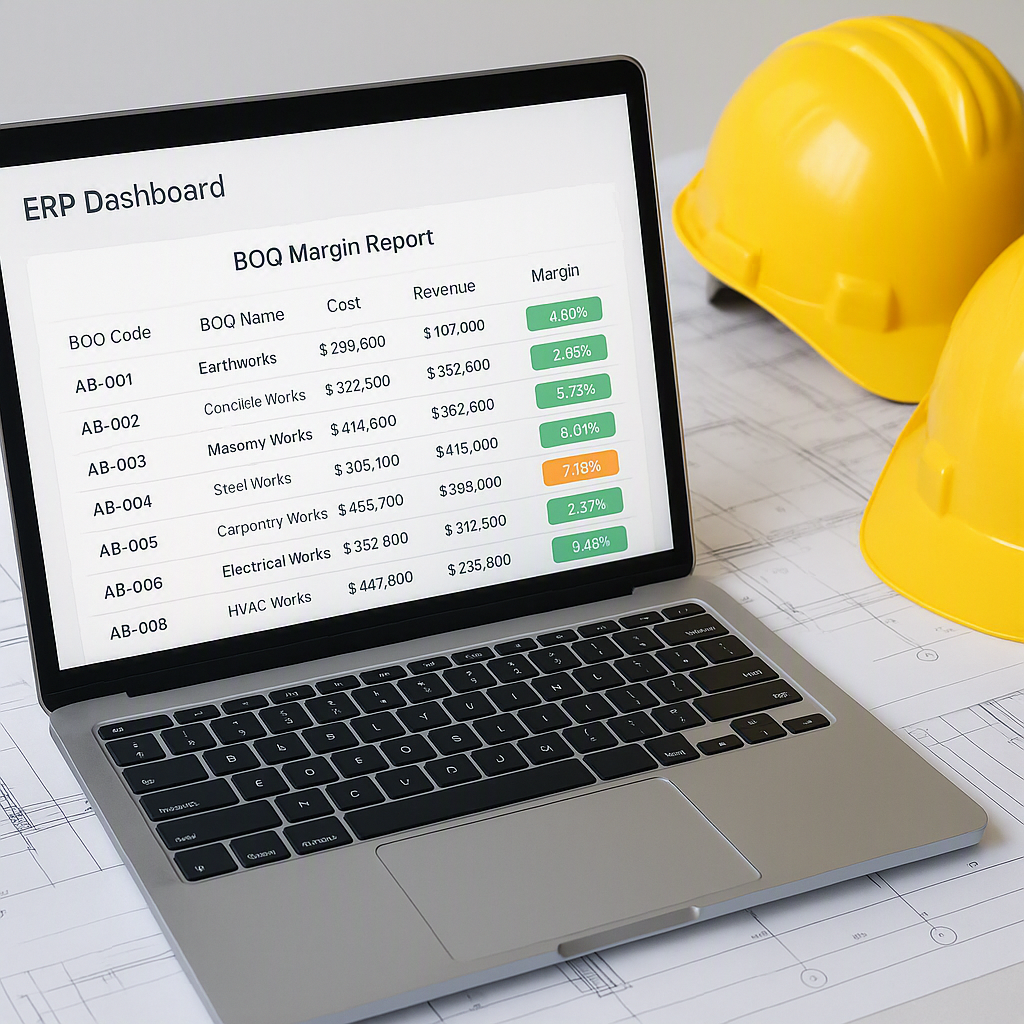
ERP systems like JobNext provide automated BOQ margin reports, saving hours of manual effort. These tools also offer drilldowns, progress tracking, and resource reconciliation for comprehensive project monitoring.
Q5: How do I recover negative margins mid-project?
Recovering negative margins involves:
- Renegotiating Vendor Contracts: Secure better pricing for materials.
- Optimizing Labor Productivity: Reduce inefficiencies in scheduling and execution.
- Scope Management: Ensure any changes are approved with corresponding revenue adjustments.
Conclusion
BOQ margin reports aren’t just a tool—they’re a lifeline for contractors who want to protect their profits. By reviewing them weekly, drilling into details, and pairing them with other reports, you can catch problems early and make informed decisions.
If you’re managing multi-trade projects and struggling with margin erosion, tools like JobNext’s structured reporting can help streamline the process. Explore JobNext →
Learn more at JobNext.ai