Why Margins Vanish in Construction Projects
Margins in construction don’t disappear overnight—they erode slowly. A missed line item here, an underestimated material cost there, and suddenly, you're staring at a project that’s bleeding profits. Sound familiar?
In our experience, the biggest culprits behind margin erosion are poor cost tracking and late interventions. By the time you realize you’re over budget, it’s often too late to fix. This is especially true for contractors juggling multiple projects and resource types—labor, material, equipment, subcontractors, and overheads.
But here’s the thing: most of these leaks are visible early. The problem? Contractors aren’t looking in the right place. Enter the BOQ (Bill of Quantities) Margin Report.
What Is the BOQ Margin Report?
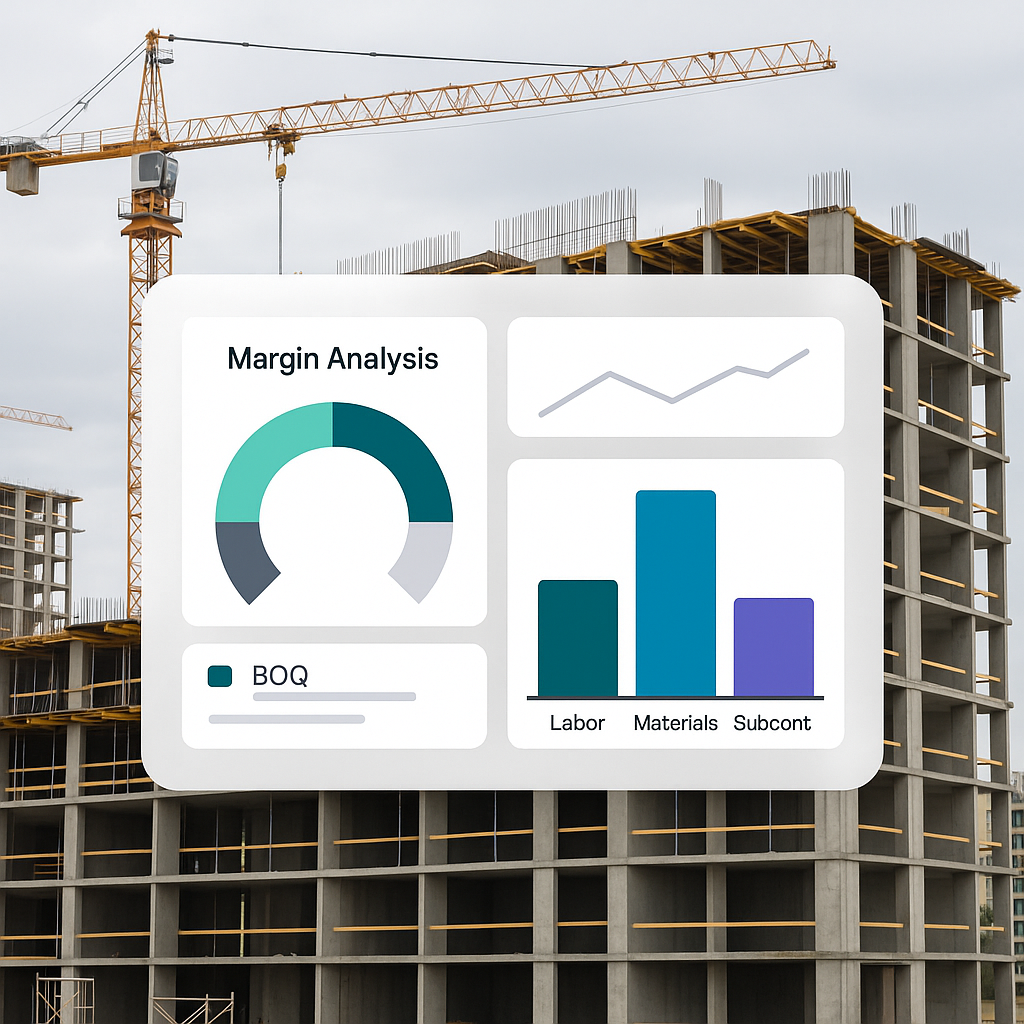
The BOQ Margin Report is a tool that breaks down profitability at the most granular level: every BOQ line item. It compares your contracted values against actual costs for labor, materials, plant, subcontractors, and overheads.
Why does this matter? Because margin erosion often starts at the BOQ level. A single line item going negative (meaning costs exceed revenue) can be an early warning sign of bigger problems—estimation errors, scope changes, or procurement cost overruns.
Example: Catching Margin Erosion Early
Let’s say you’re working on a ₹20 crore HVAC installation project. You’ve estimated ₹1.5 crore for ducting materials. Halfway through, the BOQ Margin Report flags a negative margin on that line item. Turns out, steel prices spiked, and your procurement team didn’t lock rates in advance. By catching this spike early, you can renegotiate with your client or adjust scope before it eats into overall profitability.
Why It’s a Game-Changer
The BOQ Margin Report offers granular insights that traditional financial reports or project summaries simply don’t provide. While overall project-level profitability might look fine, problems at the BOQ level often snowball into significant profit erosion if left unchecked. Think of it as a diagnostic tool for your project’s financial health.
How to Use the BOQ Margin Report Effectively
Using the BOQ Margin Report isn’t rocket science, but it does require discipline. Here’s a simple process:
1. Run It Weekly
Don’t wait until the end of the month. Weekly reviews catch problems while they’re still manageable. For example, if you notice a spike in labor costs due to unplanned overtime in week two, you can address it before it escalates further in subsequent weeks.
2. Investigate Negative Margins Immediately
A negative margin on any BOQ item is a red flag. It could mean:
- Your initial estimate was wrong.
- Scope creep wasn’t documented or billed.
- Procurement costs went over budget.
- Subcontractors are overbilling.
Actionable Tip:
Create a checklist for investigating negative margins. For example:
- Check if the original estimation was realistic. Compare it with historical data from similar projects.
- Review the scope for undocumented changes.
- Cross-check procurement invoices and POs for anomalies.
- Audit subcontractor invoices for overbilling.
3. Drill Down by Resource Type
Not all negative margins are created equal. Some might stem from labor inefficiencies, while others could be due to material wastage or equipment downtime. Tools like JobNext’s BOQ Margin Report let you break down costs by resource type, helping you pinpoint the root cause faster.
Example: Labor Costs Overrun
If labor costs are higher than expected, it could be due to:
- Unplanned overtime
- Incorrect time tracking
- Inefficient work allocation
By drilling down into attendance logs and task reports, you can identify and address the issue quickly.
4. Compare Across Projects
If you’re managing multiple jobs, compare margins across them. This can reveal systemic issues, like consistent underestimation of labor hours or material wastage. For example, if three projects show negative margins on concrete costs, it might indicate a procurement issue rather than isolated problems.
Real-World Example: HVAC Contractor Saves ₹18 Lakhs
One of our clients, an HVAC contractor in Mumbai, was struggling with shrinking margins despite securing high-value projects. After implementing JobNext’s BOQ Margin Report, they discovered that ducting materials on three projects were consistently over budget.
The Root Cause
The culprit? Their procurement team wasn’t consolidating purchase orders across projects, leading to missed volume discounts.
The Solution
By analyzing the BOQ Margin Report, they:
- Flagged the recurring issue of overpriced ducting materials.
- Consolidated procurement for similar materials across projects.
- Negotiated volume discounts with suppliers.
The Result
They saved ₹18 lakhs in material costs in just six months.
The Bigger Picture: Three-Report Health Check
The BOQ Margin Report works best as part of a broader monitoring strategy. Pair it with these reports for a full health check:
1. BOQ Progress Report
Tracks job schedules. Delays often lead to cost overruns. For example, a delayed concrete pour could lead to additional formwork rental costs.
2. Resource Reconciliation Report
Compares actual vs. budgeted costs across all resources. This helps you identify inefficiencies across labor, materials, and equipment.
3. Cash Flow Projections
A cash flow report ensures you’re not just profitable on paper but also have the liquidity to keep projects running smoothly. Cash flow gaps are a silent killer in construction projects.
At JobNext, we recommend reviewing these three reports together weekly. This ensures you’re not just catching margin leaks but also addressing schedule slippage and resource inefficiencies.
Why Most Contractors Ignore Margin Analysis (And Pay for It)
Let’s be honest. Margin analysis feels like admin work—tedious, boring, and disconnected from the “real” construction work happening on-site. But ignoring it is like driving blindfolded.
The Data Doesn’t Lie
A 2023 McKinsey report found that 80% of construction projects globally experience cost overruns. Most of these could’ve been avoided with better cost tracking and margin analysis.
Common Excuses Contractors Make:
-
“We don’t have time for this.”
- Reality: Spending 30 minutes a week on margin analysis can save you hundreds of hours (and lakhs of rupees) down the line.
-
“Our projects always make money in the end.”
- Reality: Are you sure? Many contractors only realize their margins are gone after the project ends.
-
“We trust our team to manage costs.”
- Reality: Trust is good, but verification is better. Even the best teams make mistakes.
How JobNext Simplifies Margin Analysis
JobNext’s BOQ Margin Report doesn’t just highlight negative margins—it explains why. By breaking down costs into five categories (labor, material, plant, subcontractors, overheads), it gives you actionable insights.
Example: Labor Costs Spike
If labor costs are spiking, you can:
- Check attendance logs and overtime data directly within the system.
- Review task allocation to identify inefficiencies.
Example: Material Costs Overrun
If material costs are the issue, the procurement dashboard shows you:
- Pending POs
- Vendor rates
- Delivery schedules
This level of integration saves hours of manual work and ensures nothing falls through the cracks.
Want to See It in Action?
Check out Tutor Perini’s $48M Data Center Job: Hidden Lessons for Contractor Profitability for more insights on margin control.
FAQ: Common Questions About BOQ Margin Reports
1. How often should I run a BOQ Margin Report?
Run it weekly. Frequent reviews help you catch small issues before they become major problems.
2. What’s the difference between a BOQ Margin Report and a project P&L statement?
The BOQ Margin Report focuses on profitability at the line-item level, while a P&L provides a high-level view of overall project performance. Both are important, but the BOQ Margin Report offers more actionable insights.
3. What’s the biggest challenge when using a BOQ Margin Report?
Discipline. It requires consistent updates to your project data, including costs, resource usage, and scope changes.
4. Can I use a BOQ Margin Report for small projects?
Absolutely. Even small projects can benefit from granular cost tracking. In fact, smaller projects often have tighter margins, making it even more critical to monitor costs closely.
5. What tools support BOQ Margin Reporting?
Platforms like JobNext specialize in BOQ margin tracking and provide an integrated view of costs, resources, and schedules.
Comparison Table: BOQ Margin Report vs. Traditional P&L Statement
| Feature | BOQ Margin Report | Traditional P&L Statement |
|---|---|---|
| Focus | Line-item profitability | Overall project profitability |
| Level of Detail | High (each BOQ item) | Low (aggregated costs and revenue) |
| Frequency | Weekly recommended | Monthly or end-of-project |
| Actionability | Immediate | Retrospective |
| Use Case | Identifying specific margin leaks | Summarizing project financials |
Final Thoughts: Don’t Wait for the Damage
Margins don’t erode overnight. They fade line by line, BOQ by BOQ. But with the right tools and discipline, you can catch these leaks early and protect your profits.
If you’re tired of margin erosion eating into your bottom line, give JobNext a try. Get started free →
Learn more at JobNext.ai